
The Mid Cap series is relatively new to the S&P family. The index consists of 400 domestic stocks chosen for market size, liquidity, and industry group representation. It includes industrials, financials, utilities and transportation just like the S&P 500. The difference is that the market cap of these companies is smaller than for the 500 index. To be included in the index, a stock must have a total market capitalization that ranges from about $500 million to $10 billion dollars. Estimates do vary, however. This index of 400 companies covers about 7 percent of the U.S. equities market.
The Mid Cap index incorporates a greater portion of its companies listed from the NASDAQ compared to the S&P 500. NASDAQ companies tend to be younger than those listed on the New York Stock Exchange (NYSE). Generally, companies in the Mid Cap index tend to grow faster than the more mature companies in the S&P 500. But the risk is greater.
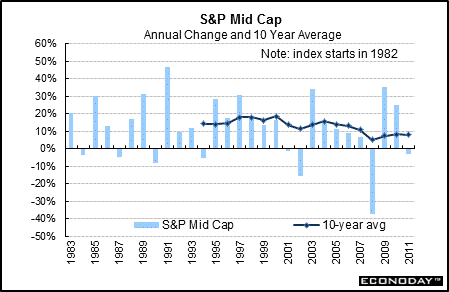
This index of mid-cap stocks declined 3.1 percent in 2011 after posting a sizable 24.9 percent boost in 2010. The 10-year average came in at 8.0 percent—down marginally from 8.2 percent in 2010.

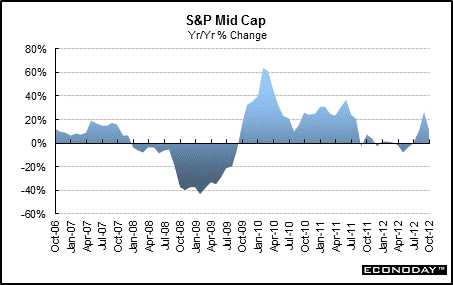
The Mid Cap index was up 10.4 percent in October on a year-ago basis, compared to 26.6 percent prior month.

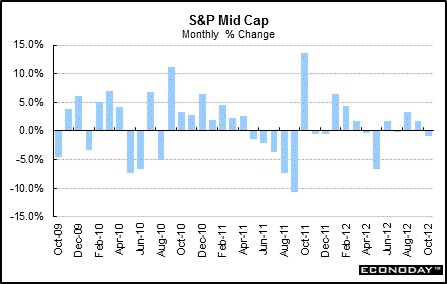
The Mid Cap dipped a monthly 0.9 percent in October after rising 1.8 percent the prior month.


About the Stock Market • The Dow Jones Family • The S&P Family • Other Key Market Indices
|