
Small Cap stocks have historically shown greater returns than large cap stocks. This is a new index in the S&P family, but the Russell 2000 has a longer history and also measures the small cap sector. Market capitalization roughly ranges from $20 million to $3 billion. This index of 600 companies covers about 3 percent of the U.S. equities market.
Just like the S&P 500 and the Midcap, the Small Cap index includes industrials, utilities, financials and transportation. A larger portion of the companies in this index is from the Nasdaq than for the other two index measures.
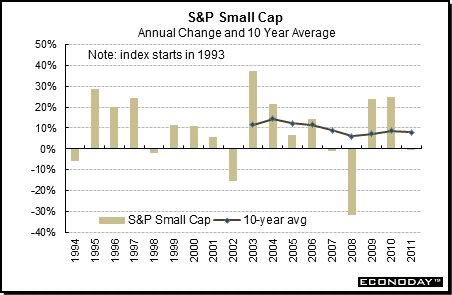
The S&P Small Cap index edged down 0.2 percent in 2011 after surging 25.0 percent the previous year. The ten-year average posted at 8.0, compared to 8.6 percent in 2010.
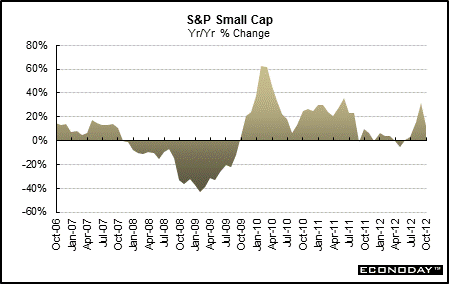
Like most other indexes, European sovereign debt concerns (on and off) caused swings during most of 2010 and 2011. But an improving economy in the U.S. helped to offset some of these worries even though Congressional bickering over federal deficit legislation weighed on stocks in late summer of 2011. In very early 2012, progress on European sovereign debt and mostly favorable economic news supported gains. But worries about European debt swung the other way in at mid-year and the recovery slowed. Fiscal cliff worries grew stronger in October.
In October, the Small Cap index was up 12.2 percent on a year-ago basis versus 31.7 percent the month before.
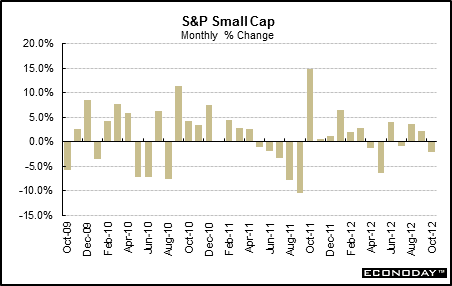
The Small Cap index declined 2.1 percent in October after gaining 2.2 percent in September.

About the Stock Market • The Dow Jones Family • The S&P Family • Other Key Market Indices
|