
This index is based on 500 companies with capitalization ranging from $1 billion to $600 billion, according to S&P. This index captures 75 percent coverage of U.S. equities.
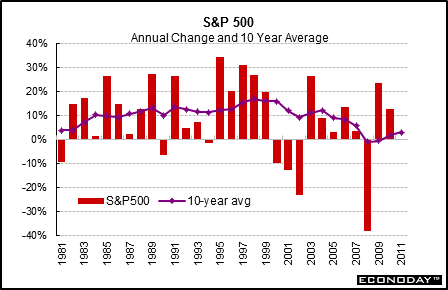
The S&P 500 ended 2011 where it started with no change for the year, after gaining 12.8 percent in 2010. After outpacing the Dow in 2009 and 2010, the S&P fell behind its Blue Chip cousin in the latest year. The 10-year average for the S&P 500 improved to 3.0 percent from 1.7 percent in 2010.

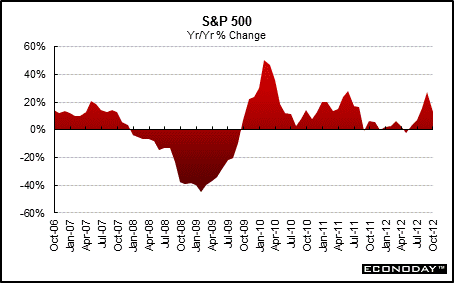
The S&P 500 waned on a year-over-year basis in latter 2007 and into 2009 due to subprime concerns, the credit crunch, and recession. An improved recovery boosted stocks in 2010 though worries about Europe were off and on. A slowing economy added to revenue concerns in 2012 but cost cutting kept profits and equities up net for 2012 through late summer. The S&P 500 in October posted a year-ago gain of 12.7 percent, compared to 23.7 percent the prior month.

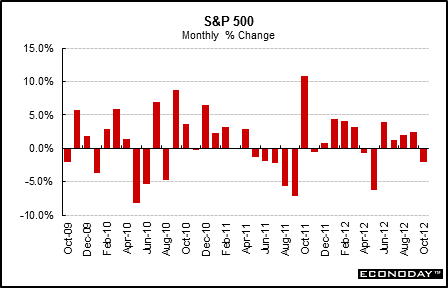
The S&P 500 slipped 2.0 percent in October after increasing 2.4 percent in September.


About the Stock Market • The Dow Jones Family • The S&P Family • Other Key Market Indices
|