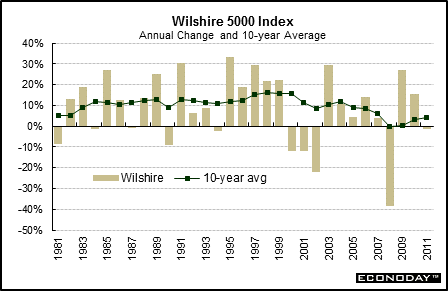

The Wilshire 5000 is the most comprehensive of market indicators. It includes all publicly traded U.S.-based companies – now more than 7000. The Wilshire 5000 until mid-2009 had an association with the Dow Jones companies but switched to an association with Nasdaq. Dow Jones now calculates a comprehensive index intended to match the methodology of the Wilshire 5000 (but does differ slightly). It is called the Dow Jones Total Stock Market Index. However, the official Wilshire 5000 (from the Nasdaq site) continues to be referenced here. The Wilshire 5000 slipped 1.3 percent in 2011 after jumping 15.7 percent in 2010. The 10-year average improved to 4.3 percent from 3.3 percent in 2010.

The Wilshire 5000 is widely monitored by Fed officials because this index indicates the pattern of consumer wealth, reflecting changes in the broad equities market. The “wealth effect” is the concept that consumers are more likely to spend more money on goods and services when the stock market is appreciating. Conversely, consumers could curtail spending when the stock market is declining.
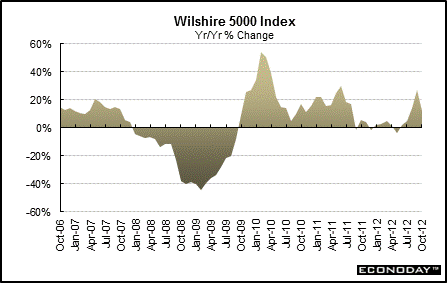
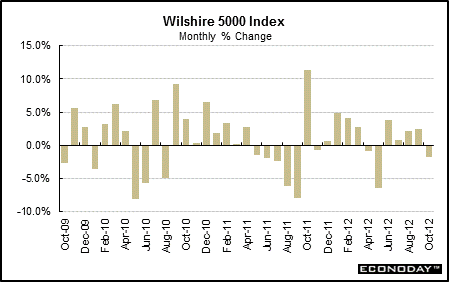
The Wilshire 5000 in 2008 and during early 2009 turned decidedly negative over continued concerns over housing and credit markets and a worsening recession. But an easing of the recession and recovery led to improvement during spring of 2009 and through 2010. Sovereign debt concerns caused volatility in 2010 and 2011. Healthy earnings and good economic news boosted equities in early 2011 but disappointing economic news and European sovereign debt worries weighed on equities at mid-year. Congressional wrangling over the federal debt ceiling also pushed stocks down. Stronger economic data and reversal of worries over European sovereign debt supported stocks in October 2011 and in early 2012. Again, re-heightened concern about European debt pushed equities down in mid-2012 with a modest rebound in summer 2012. Slower growth and fiscal cliff worries weighed on stocks in autumn 2012.
The Wilshire 5000 in October was up 12.0 percent on a year-on-year basis, compared to 27.0 percent the prior month.

The Wilshire 5000 dipped a monthly 1.8 percent in October, following a 2.5 percent rise in September.


About the Stock Market • The Dow Jones Family • The S&P Family • Other Key Market Indices
|