Gross Domestic Product and Industrial Production —
After real GDP averaged 3.25 percent annual growth in the 1990s, the economy fell into a mild recession in the second and third quarters of 2001. This is despite recent Bureau of Economic Analysis revisions that amended the data and now show no decline at that time. The events on September 11, 2001 exacerbated the downturn already in progress. GDP recovered in the first quarter of 2002 and the economy has grown in fits and starts since then. A strong housing market combined with low interest rates fueled consumer spending. The economy soared in the second half of 2003 and into 2004 thanks to tax cuts that gave consumers more money to spend.
But while growth slowed perceptively in the first half of 2008, gross domestic product remained positive until the third quarter. Employment along with plunging house prices continues to wound consumer spending severely. The credit crunch and ensuing financial market woes spread to the real economy and brought growth to a screeching halt. Although oil prices were down from their highs it was too late to save consumer spending and corporate profits and they both sank. According to GDP, the economy emerged from recession in the third quarter of 2009.
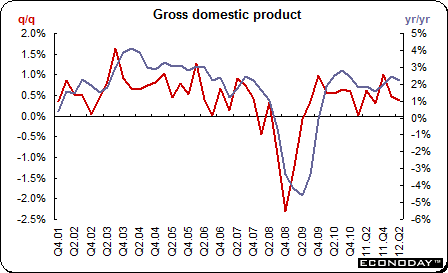
GDP turned positive again in the third quarter of 2009 and has continued to grow. First quarter GDP in 2012 was up 0.5 percent on the quarter and 2.4 percent when compared with the same quarter a year ago. On an annualized basis, GDP was up 2.0 percent. Gross eased according to advance data for the second quarter. On the quarter, GDP was up 0.4 percent and 2.2 percent on the year. On an annualized basis GDP was up 1.5 percent.
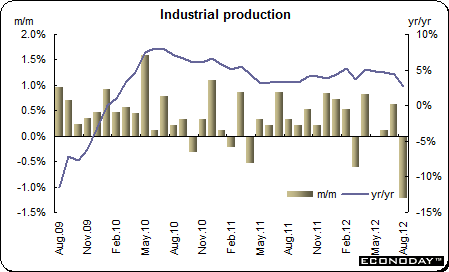
Industrial production in July dropped 1.2 percent but was up 2.8 percent on the year while the manufacturing component sank 0.7 percent and up 4.0 percent on the year. Output was cut in part by Hurricane Isaac that hit the Gulf coast. Overall output has been up five of eight months in 2012 — one month was flat. Manufacturing was up five of eight months.
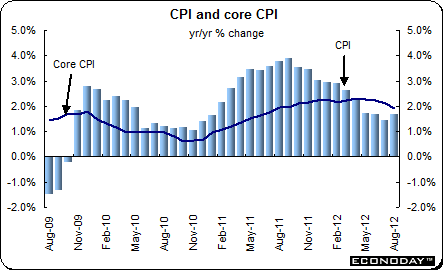
Inflation — August consumer prices were up 0.6 percent on the month while the core which excludes food and energy edged up 0.1 percent. On the year both the CPI was up 1.7 percent while the core was up 1.9 percent.
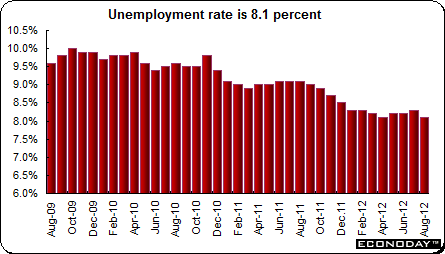
Unemployment — The civilian unemployment rate bottomed out at 3.9 percent in September 2000, a rate that had not been seen since January 1970. But with the onset of recession, unemployment climbed especially in the manufacturing sector. Increases in unemployment were mitigated by the mild nature of the recession. Unemployment is typically a lagging indicator and generally increases even after a recovery is in place. Unemployment was on a downward trajectory until July 2006, when it climbed to 4.8 percent after two months at 4.6 percent. The unemployment rate ranged narrowly between 4.4 percent and 4.8 percent in 2007 until December 2007 when it jumped to 5 percent.
The unemployment rate climbed rapidly since then and was 10.0 percent in November and December 2009 but eased to 9.7 percent in January 2010 where it was for three months before it resumed its downward track. After edging downward in February and March 2011, the unemployment rate bounced back up to January’s 9.0 rate in April as more people reentered the labor force. The unemployment rate was 9.1 percent in June, July and August. It edged down to 9.0 percent in September and to 8.9 percent in October. November declined to 8.7 percent and was down to 8.5 percent in December. Since the beginning of 2012, the unemployment rate has fluctuated between 8.3 percent and 8.1 percent. It currently stands at 8.1 percent.
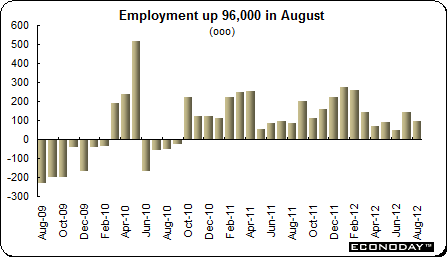
Employment plummeted for 22 consecutive months reaching a crescendo in January 2009 when 818,000 jobs were lost in that month alone. The employment declines remained massive even as they steadily declined in size. Employment finally bumped up in March, April and May of 2010. The improvement in employment continues to be slow with the number of new jobs fluctuating from month to month rather than showing the steady and rising increases that are typical of previous recoveries. Employment has increased in every month since October 2010. Employment in July 2012 increased by a revised 141,000. However, in August, employment gains weakened to an increase of 96,000.
Merchandise trade — The United States reliance on foreign goods intensified in the 1990s, although export growth improved modestly during the period too. In good economic times, imports help alleviate demand pressures and therefore help curtail price inflation for goods and services. In downturns, a decline in demand for goods also leads to a drop in import demands so that foreign producers feel the effect of a U.S. downturn and the negative impact on domestic producers is mitigated to some extent. Investors overseas have mixed feelings about the U.S. trade deficit. On one hand it means that U.S. consumers continue to buy their exports, which in turn stimulates their domestic economies. Despite the declining dollar, U.S. exports have not made a sizable dent in the deficit thanks to the rising price of crude imports.
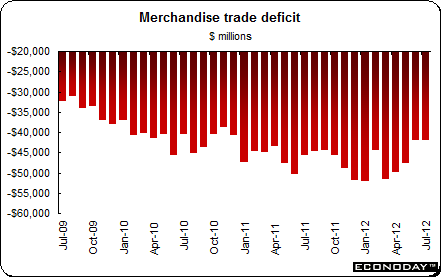
The trade deficit is viewed as an Achilles heel by traders — especially those in the currency markets who view this deficit along with the fiscal deficit as major U.S. vulnerabilities. Trade was one of the hardest hit areas in this global recession.
|