Gross Domestic Product
The Canadian economy managed to grow without a recession for 15 years. But that changed as the worldwide recession drastically reduced its need for Canadian exports. On a geographic basis, the west, with its vast mineral resources has outperformed the manufacturing reliant east. Unlike the U.S., Canada releases GDP data only once a quarter, usually about two months after the reference quarter’s end.
Growth slowed dramatically in 2008 as seen in the graph below. Although the fourth quarter of 2008 in reality was the first quarter in which the economy contracted, there was little doubt that the recessionless streak had ended. The economy contracted for three quarters before rebounding in the third quarter of 2009. Canada has continued to grow steadily since then. Growth slowed in 2011. After increasing by 0.9 percent on the quarter, growth edged down 0.1 percent in the second quarter. However, the economy expanded 1.0 percent in the third quarter. Fourth quarter 2011 advanced GDP 0.5 percent on the quarter and was up an annualized rate of 1.9 percent.
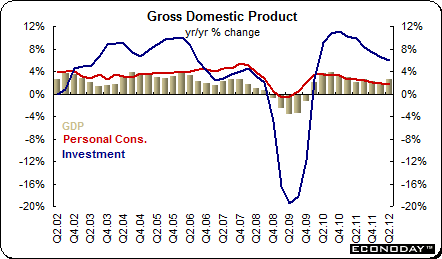
In the first quarter of 2012, GDP was up 0.5 percent for a second quarter and was up at an annualized pace of 1.8 percent. The second quarter was up 0.5 percent as well and at an annualized pace 1.8 percent. On the quarter, personal consumption expenditures were up 0.3 percent after edging up 0.2 percent in the previous quarter. Gross business investment eased to a gain of 1.6 percent after a first quarter gain of 1.9 percent.
Monthly gross domestic product
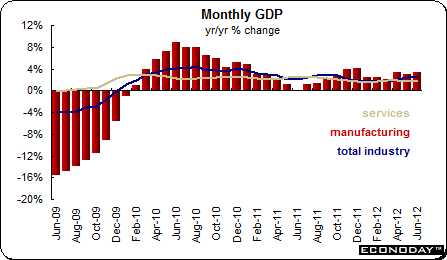
In addition to quarterly GDP data, Canada also releases monthly data for gross domestic product at basic prices. The data provide a monthly update on the economy’s performance and a check on the quarterly GDP data. In June, monthly GDP was up 0.2 percent and increased 2.4 percent on the year. Manufacturing was slipped 0.2 percent but was 2.4 percent higher on the year. Services were up 0.1 percent and 1.8 percent.
Inflation
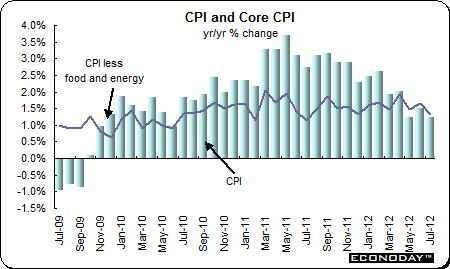
There are several price indexes that can be used to sniff out inflationary trends if they exist. They are the consumer price index plus its two major core measures and the industrial product price and the raw material price indexes. The latter two measure producer inflation while the CPI measures inflation at the consumer level. Consumer inflation has remained under control and mostly within the Bank of Canada’s target range of 1 percent to 3 percent. From March though September 2011, the annual rate of inflation exceeded 3 percent. The CPI then moderated and was once more within the BoC’s inflation target range. In July, the CPI was down 0.1 percent but was 1.3 percent higher on the year.
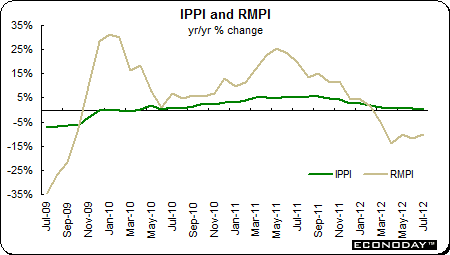
Producer prices have been volatile. However, after a period of rising prices, the increases have begun to moderate. It should be noted that producers for the most part are unable to pass along high raw material prices. Some of the raw material price changes were exacerbated by exchange rate volatility which in turn feeds back into these prices. Soaring and sinking commodity prices also played a role.
Unemployment — After climbing to a high of 8.7 percent in August 2009, the unemployment rate has steadily declined to 7.2 percent. The unemployment rate had been in the range of 7.4 percent to 7.6 percent since October 2011. Employment added over 190,000 jobs for the year 2011 despite declines in both October and November. In the first eight months of 2012, 158,900 jobs have been added despite declines in February and July.
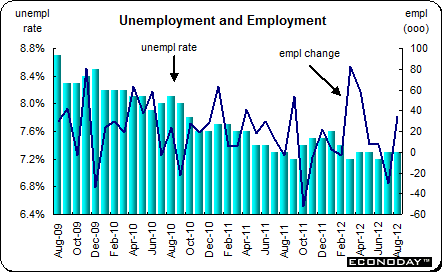
Merchandise trade — Canada consistently runs a trade surplus with the U.S. and on occasion, Japan — but a deficit with all other trading partners. The trade surplus declined in 2006 primarily because of the relatively high value of the Canadian dollar against most other currencies, but especially against the U.S. dollar.
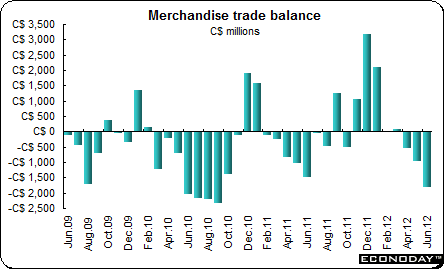
The Canadian merchandise trade balance recorded a deficit in December 2008 for the first time since March 1976. The trade balance since then has veered from positive to negative. The balance was in deficit for eight of 12 months in 2011. The trade balance recorded a surplus in the first three months of 2012 but slipped into deficit in April, May and June thanks to weakening exports.
The trade balance in part, has been affected by the Canadian dollar’s exchange rate. The higher value of the currency made Canadian exports more expensive while at the same time, making imports cheaper. With the Canadian dollar value relatively high especially against the U.S. dollar, the balance will continue to be affected by the currency’s value along with demand for the country’s key commodities.
|