 |

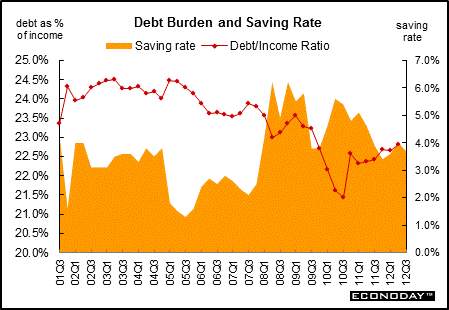
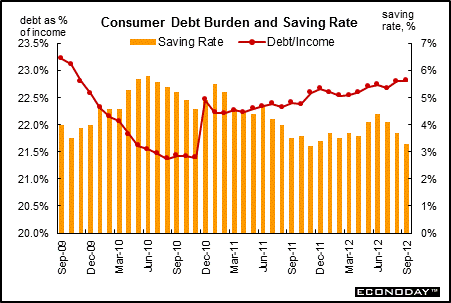
The debt-to-income ratio peaked most recently in the first quarter of 2005, at the same time that the personal savings rate plunged in response to increased light truck purchases. Also, home equity lines of credit were still in vogue as the housing crunch had not yet set in. Improvement has been erratic since 2005. But deleveraging accelerated during 2009, 2010 and 2011 as consumers tucked their credit cards away and banks have both reduced credit limits and continued sizeable charge-offs. But in latter 2011 and mid-2012 there were signs that the consumer credit situation had improved.

The debt-to-income ratio had been trending downward during 2005 and 2006 but that trend reversed during 2007 and into early 2008. The rise in this ratio reflects some moderate acceleration of debt growth as income growth remained moderately healthy into early 2008. During mid-2008, the personal saving rate spiked due to government rebate checks. Consumers chose to not spend all of the rebate money – at least not during the month the check was received. This also temporarily bumped down the debt/income ratio. More recently in 2011, the personal saving rate slipped due to consumers (at least those with jobs) boosting spending relative to income gains. Late in 2009 and into early 2011, consumers continued to deleverage debt. Late in 2011, consumers appeared to be willing to take on a little more debt as the labor market stabilized and the aging auto fleet boosted auto demand. Debt rose in late 2011 and mid-2012—primarily due to improved auto sales and due to increased student loans.

 |


Production & Sales •
Inflation •
Federal Reserve Policy •
Interest Rates
|
 |

