
Late in 2006, the PPI slowed more than the CPI with lower oil prices pulling down the overall PPI growth rate. Strong services inflation kept the CPI up while the slowing economy had more impact on the PPI which does not have services. A surge in oil prices during the second half of 2007 and first half of 2008 boosted CPI and PPI inflation back up with PPI inflation back above that for the CPI. That trend briefly reversed on the oil price decline during the second half of 2008. Recently higher oil prices in late 2009 and into 2011 put the PPI back above the CPI rate. Weak shelter cost inflation also weighed the CPI down until latter 2011. Shelter cost inflation picked up moderately late in 2011 and well into 2012, no longer softening overall inflation as just after the recession.
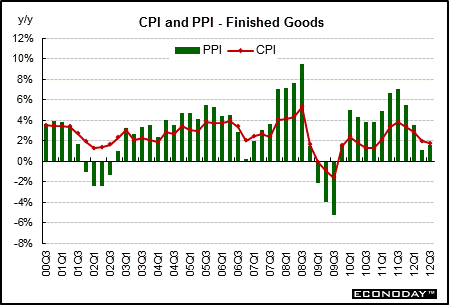
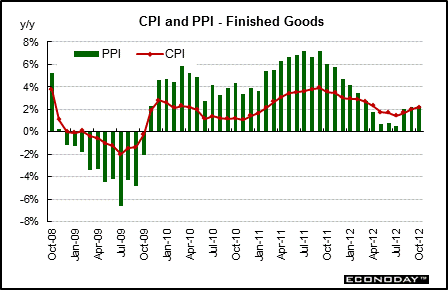
Both the PPI and the CPI inflation rose during the first half of 2008 due to higher oil prices with food also contributing. Sharply declining oil prices over the second half of 2008 helped to ease headline inflation—which helps the Fed focus on getting the economy out of recession. Oil prices firmed in late 2009 and mostly through 2011, boosting year-ago CPI and PPI headline numbers. Recent declines in oil prices at mid-2011 softened the year ago-pace. Oil price increases in late 2011 were not obvious in year-ago rates. Declines in energy costs in 2012 are showing up in the numbers although not as much as early in the year. For October 2012, on a year-on-year basis, the overall PPI was up 2.3 percent while that for the CPI was up 2.2 percent. Most Fed officials called the run up in headline inflation in mid-2011 “transitory” and it appears that they were right.

Production & Sales •
Inflation •
Federal Reserve Policy •
Interest Rates
|