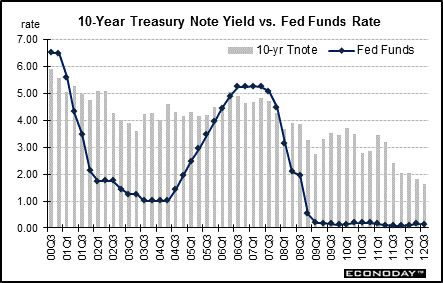
The spread between the 10-year Treasury note yield and the federal funds rate averaged 62 basis points in the 1980s. Interest rates were generally high during the period, and so was inflation. In the 1990s, the spread firmed so that the 10-year note yield surpassed the funds rate by 150 basis points on average. Between 2000 and 2011, the spread between the 10-year note and the federal funds rate averaged 173 basis points.
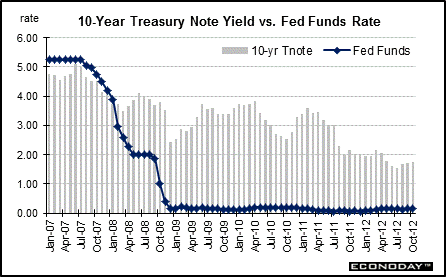
More recently, the spread averaged minus 39 basis points in 2007 (fed funds is higher than the Treasury note), but this average bounced back in 2008 to plus 174 basis points, reflecting the Fed’s aggressive easing. In 2009, this spread grew to 310 basis points on fears of excess supply from financing the jump in the federal deficit but slipped to 304 basis points in 2010 and to 268 basis points in 2011.

While yields on long-term securities generally move in tandem with changes in short term securities, long-term yields generally do not move by the same magnitude. In 2004, through 2007 yields on long-term securities, such as the 10-year note, did not move in tandem with rate hikes orchestrated by the Federal Reserve. Indeed, 10-year note yields were higher before the first rate hike in June 2004 than in the months after when the Fed raised the funds rate target at each FOMC meeting in 2004 and 2005 and through the last recent hike in June 2006. In 2007 and into 2008, long-term rates had come down both due to slower growth in demand for loanable funds and also due to expectations of lower inflation.
The fed funds rate target was boosted 17 times and 425 basis points over the June 2004 through June 2006 period, but the 10-year average yield did not increase by a similar magnitude. This is primarily because long rates are relatively stable as long as inflation expectations are stable. Rates did firm a little in mid-2008 due to inflation concerns but softer inflation numbers and recession worries eased those inflation concerns by late 2008. Flight to safety also helped pushed rates down into January 2009. But in the first half 2009 and in early 2010, better economic news, reversal of flight to safety into equities, and fears of looming deficits boosted rates. But for most of 2010, rates softened on European sovereign debt concerns and on the Fed expanding its balance sheet with purchases of Treasuries. A stronger economy and some reversal of flight to safety pushed rates back up in early 2011. However, in mid-2011, the economy slowed and sovereign debt worries returned, basically weighing on rates well into 2012. The Fed’s “Operation Twist” also tugged down on long-term rates as did the announcement of a third round of quantitative easing.
The average 10-year note yield firmed 3 basis points in October to 1.75 percent.

Values shown reflect monthly averages.


About the Bond Market • Bond Market Charts • Treasury Market Charts • Treasury Auctions
|

